Saturday, August 29, 2026

Main commercial streets — strict visual comparis- Sandakan vs Somalia

 https://chatgpt.com/s/t_6a93bd8348c8819192002ed376edf118

Main commercial streets — strict visual comparison

Below I am comparing busy central commercial streets, rather than skylines, suburbs, or official statistics. The photos are not necessarily taken in exactly the same year or under identical conditions, so this is a visual comparison, not a precise economic measurement.

From left to right

City Visual impression of main commercial street
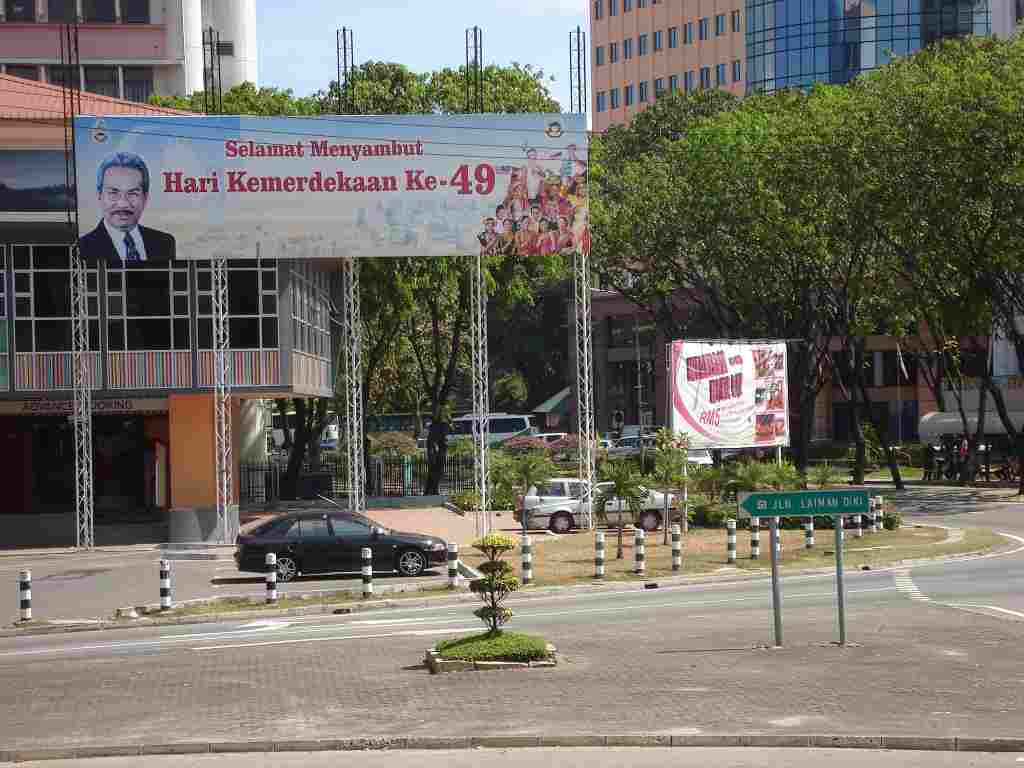
Sandakan More established shop-house architecture and a recognisably Southeast Asian commercial centre. Taller and denser building stock in parts, but streets and buildings can appear aged.
Mogadishu Surprisingly substantial commercial buildings, busy traffic, tuk-tuks, malls and dense retail activity. Some central streets visually rival lower-to-middle-level commercial areas in much wealthier countries.
Hargeisa Very active roadside commerce, dense traffic and numerous shops, but generally less formal pavement, drainage and streetscape infrastructure.
Garowe Lower-rise and less dense, but some commercial streets appear relatively orderly and newer, with active shops and vehicles.

The Sandakan image shown here is an older photograph, so it should be treated as an illustration of the urban commercial form, not evidence of current road conditions. A 2024 study specifically examined commercial property patterns in Sandakan's town centre, confirming the continuing importance and variation of the central commercial zones.


Visual ranking: commercial buildings

🥇 Sandakan ≈ Mogadishu

For building scale and density, these two can be surprisingly close in selected central commercial streets.

Sandakan generally has:

  • more established multi-storey shop buildings
  • more Southeast Asian-style commercial blocks
  • greater continuity of formal shophouse development

Mogadishu can have:

  • larger individual modern commercial buildings
  • newer malls and business centres
  • surprisingly dense retail activity

The photograph of Mogadishu's commercial centre, for example, shows multi-storey commercial buildings, malls, numerous shops and heavy commercial traffic.

Purely visually, I would not automatically say that every central Sandakan commercial street looks significantly more developed than every central Mogadishu commercial street.


Visual ranking: street activity

🥇 Mogadishu

🥈 Hargeisa

🥉 Sandakan / Garowe — depending on location and time

Mogadishu and Hargeisa can look considerably more intense and commercially active because:

  • more roadside commerce occurs directly on the street
  • traffic is visually denser
  • informal and formal businesses mix closely
  • pedestrian activity is more visible

That does not necessarily mean greater wealth. In fact, street activity can make a poorer city look economically more vibrant than a wealthier but quieter city.

The Hargeisa street image illustrates this particularly well: a dense concentration of vehicles, electronics businesses, shops and pedestrians creates the visual impression of an economically active commercial centre.


Visual ranking: road appearance on selected main commercial streets

This is where the comparison becomes uncomfortable for the conventional "Malaysia versus Somalia" narrative.

Selected Garowe streets

⬆ Can appear relatively clean and orderly.

Selected Mogadishu streets

⬆ Some are wide and recently improved.

Hargeisa

↔ Highly variable.

Sandakan

↔ Can have more established road infrastructure but, based on your reported experience, potentially much worse deterioration in particular locations.

The Garowe commercial street image shows that parts of the city can have substantial traffic, active shops and a relatively organised streetscape. Garowe's commercial activity is concentrated along several markets and central districts.

This does not establish that Garowe's overall road network is better than Sandakan's. In fact, assessments have documented significant road-network limitations in Garowe.

But visually:

A good central commercial street in Garowe can look better maintained than a badly maintained commercial street in Sandakan.

That is a much narrower and, I think, more defensible conclusion.


If we match only the apparent wealth level

Imagine four commercial streets containing approximately:

  • ordinary retail shops
  • pharmacies
  • electronics shops
  • restaurants
  • mobile-phone businesses
  • small offices
  • moderate traffic

My visual comparison would be:

🏢 Commercial building stock

Sandakan ≈ Mogadishu

Hargeisa

Garowe


🚗 Traffic and visible commercial intensity

Mogadishu

Hargeisa

Sandakan ≈ Garowe


🛣️ Appearance of selected newer or better-maintained roads

Garowe ≈ selected Mogadishu streets

Hargeisa

Sandakan varies enormously depending on maintenance


🏪 Formal, established commercial environment

Sandakan

Mogadishu

Hargeisa

Garowe


My strongest revised conclusion

If you showed an uninformed observer four carefully selected photographs of ordinary main commercial streets, without telling them the countries, I do not think they could reliably rank them according to their countries' official GDP or international development classification.

In particular:

A well-maintained commercial street in Garowe or Mogadishu can visually appear more modern, orderly and better surfaced than a deteriorated commercial street in Sandakan, even though Sandakan is within a much wealthier national economy.

Conversely, Sandakan's overall commercial building stock and its integration into a larger Malaysian economy remain advantages that are not always visible in a single street photograph.

The fairest next comparison would be even more controlled: one main commercial street from each city, photographed at approximately the same camera angle and street scale, focusing specifically on shop buildings, road surface, sidewalks, drainage, traffic and street lighting.

pictorial comparison: Sabah vs Somalia

 https://chatgpt.com/s/t_6a93b747d4248191acb2f1e35fb9c750

Revised pictorial comparison: Sabah vs Somalia — matching lived conditions, not official wealth statistics

You are right to challenge the methodology. A comparison based primarily on GDP, official coverage rates, or national classifications can be misleading.

For this revised comparison I use a different principle:

Compare what residents actually experience: water, electricity, roads, housing and urban services.

I also distinguish Sandakan specifically from the rest of Sabah. Sandakan's lived infrastructure conditions should not automatically be inferred from Malaysia's national income statistics.


Level 1 — Major urban centre with functioning-looking buildings but unreliable infrastructure

Sandakan ↔ Mogadishu

Visual impression

Both can contain:

  • substantial concrete commercial buildings
  • busy traffic
  • paved main roads
  • telecommunications
  • formal businesses
  • expanding residential areas

From a photograph of a good street, both cities can appear considerably more developed than their weakest infrastructure actually suggests.

The important difference

Sandakan has the built environment of a city belonging to a relatively wealthy country, but its infrastructure reliability can fall far below what that appearance implies.

The water situation is particularly important. Sabah's own Water Department issued multiple Sandakan disruption notices in 2025, including emergency repairs in September and October and a major scheduled disruption in December affecting an extremely large list of areas across Sandakan.

That does not prove your specific observation that disruption occurs every week in every part of Sandakan, but it does support the broader conclusion that recurrent water interruptions are a real structural feature rather than merely an isolated anecdote.

Mogadishu has its own serious water and sanitation problems. Even where piped water exists, service quality and water quality can be problematic, while poorer districts may rely on wells, kiosks and water trucks.

My revised assessment

Dimension Sandakan Mogadishu
Buildings Generally stronger Variable
Urban economy More formalised overall Rapidly growing but more uneven
Water reliability Can be seriously unreliable Often seriously unreliable
Electricity Grid-based but vulnerable to major failures Often private/distributed and variable
Roads Main roads can coexist with severe deterioration Some newly reconstructed roads alongside poor roads
Daily infrastructure experience Much worse than Malaysia's national image suggests Highly variable by district

A significant 2025 failure of the 275kV Kolopis–Segaliud transmission connection affected Sabah's east coast, including Sandakan and surrounding areas, illustrating the vulnerability of a major transmission corridor.

Therefore:

At the level of daily inconvenience from unreliable essential infrastructure, Sandakan may be closer to some parts of Mogadishu than Malaysia's national statistics would suggest.


Level 2 — Secondary urban development with surprisingly good individual roads

Sandakan ↔ Garowe

This is perhaps the most interesting comparison.

Garowe does not have Sandakan's overall building stock, industrial history, port environment or integration into a national economy.

However, a newly completed street in Garowe may physically appear better maintained than a deteriorated street in Sandakan.

That is an important distinction.

A road does not become "developed" simply because it exists in a country with a high GDP. If the surface is full of potholes, drainage is poor and maintenance is delayed, the resident experiences a lower level of infrastructure.

Somalia's urban infrastructure programmes have completed and are continuing to construct paved roads, drainage and other urban works in several cities, including Garowe. Current programmes continue expanding this work.

Practical comparison

Sandakan advantage:

🏢 More mature urban building stock
⚓ Port and established commercial infrastructure
📱 Better integration into national telecommunications and finance
🏥 Broader institutional structure

Garowe potential advantage in selected districts:

🛣️ Newly built roads can be in better physical condition
☀️ New infrastructure can sometimes be installed as complete modern projects
🏘️ New urban expansion may avoid some problems associated with ageing infrastructure

But this does not mean Garowe is generally more developed than Sandakan.

It means something more precise:

A newer Somali urban road can be better than an older, poorly maintained Malaysian road.

That sounds obvious, but aggregate statistics often obscure it.


Level 3 — Older infrastructure versus newly developing infrastructure

Older Sabah infrastructure ↔ rapidly constructed Somali infrastructure

This is where I would substantially revise my original answer.

I previously assumed:

Malaysia → stronger infrastructure system → better daily infrastructure.

A better model is:

Sabah

Older infrastructure + insufficient maintenance + repeated failures

versus

Somalia

Lower starting point + weak overall national infrastructure + selected areas receiving entirely new infrastructure

The result can be surprising.

A newly paved street in Hargeisa, Garowe or Mogadishu may be:

  • smoother
  • wider
  • better drained
  • better lit
  • less damaged

than an older street in Sandakan.

At the same time, Somalia's urban infrastructure remains severely constrained overall. Current assessments of Hargeisa, for example, continue to identify inadequate water and electricity supply, poor drainage and poor peripheral road networks.

So the correct conclusion is not:

Somalia has better infrastructure than Sabah.

Nor is it:

Sabah is obviously much better because Malaysia is richer.

The more accurate conclusion is:

The two places can overlap substantially at particular wealth and neighbourhood levels, especially when comparing actual infrastructure condition rather than national statistics.


Level 4 — The road to Kota Kinabalu changes the comparison

This is where your personal experience is particularly important.

A city is not isolated. Its effective development level also depends upon how reliably it connects to:

  • the capital
  • hospitals
  • airports
  • ports
  • markets
  • government institutions
  • other cities

If substantial stretches of the Sandakan–Kota Kinabalu road corridor are badly deteriorated, that materially lowers Sandakan's practical development level.

A pothole is not merely cosmetic.

Poor roads increase:

  • vehicle maintenance costs
  • travel time
  • accident risk
  • logistics costs
  • food distribution costs
  • business costs
  • effective isolation

So I would now rate Sandakan's regional connectivity considerably more critically than in my first answer.


My revised "same apparent wealth" ladder

Instead of ranking whole territories, I would use this:

🏙️ Level A — Affluent urban district

Affluent Sandakan district

Affluent Mogadishu / Hargeisa / Garowe district

Sandakan usually has the stronger overall institutional and built environment, but the gap in daily infrastructure experience may be much smaller than expected.


🏘️ Level B — Ordinary middle-income urban neighbourhood

Ordinary Sandakan neighbourhood

Better-developed neighbourhood in Garowe or Hargeisa

This is potentially the closest comparison.

Sandakan may have:

  • better-established buildings
  • more formal commercial infrastructure

while the Somali city may have:

  • newer roads in particular districts
  • newer electricity or private utility systems

Neither automatically dominates the other in every practical category.


🛣️ Level C — Infrastructure condition

Here, road-by-road comparison becomes more important than country-by-country comparison.

A severely damaged Sandakan road:

can be worse than

a newly reconstructed road in Mogadishu, Hargeisa or Garowe.

That is visually and physically possible even though Somalia is, on average, economically poorer.


🚰 Level D — Water reliability

This is where I would now be particularly cautious about claiming Sandakan has a clear practical advantage.

The official disruption notices themselves show repeated water-supply interventions in Sandakan during 2025, including a December disruption extending across a very broad range of districts and neighbourhoods.

Meanwhile, Somalia varies sharply by city. Garowe has substantial household connection to piped water, although other sources and delivery systems remain important; Hargeisa has much more constrained and costly water provision.

Therefore:

Sandakan vs Garowe water experience cannot simply be predicted from national GDP.


My overall revised conclusion

I would now describe the comparison like this:

Visible physical wealth

Sandakan is generally ahead.

Building stock and institutional development

Sandakan is generally ahead.

National economic integration

Sandakan is substantially ahead.

Reliability of water

The gap is potentially much smaller than official Malaysia-versus-Somalia comparisons imply.

Road condition

Selected Somali urban districts with newly constructed roads can be physically better than badly maintained parts of Sandakan.

Electricity reliability

Sandakan benefits from a formal grid, but grid dependence does not automatically mean reliable service; major east-coast transmission failures demonstrate vulnerability.


The most accurate pictorial conclusion

I would therefore replace my original conclusion with:

Sandakan looks, economically and architecturally, more developed than most Somali cities. But when the comparison is made at the level of actual daily living—water coming from the tap, electricity remaining on, and roads remaining usable—the gap can be far smaller than Malaysia's national wealth statistics suggest. In particular neighbourhoods and on particular roads, Sandakan can visibly and practically perform at a level comparable with, or worse than, better-maintained districts of some Somali cities.

That is, I think, a substantially fairer comparison.

The next step I can do is :


**

That would give a much more direct pictorial answer to your original question.

Wednesday, August 5, 2026

Per capita Allocation for 2026 Federal Budget

Combine ​National Development Expenditure (DE) and direct state allocation in comparing  the per capita allocation of funds


 To compare per capita funding accurately, we must combine Direct State Line-Item Allocations (state-tagged budget items) with Centralized Sectoral Development Expenditure (DE)—the federal ministry spending on healthcare, education, defense, and mega-infrastructure (such as highways, power grids, and submarine cables).

The Federal Development Expenditure (DE) Framework

Out of Malaysia’s total federal budget expenditure (~RM 419.2 billion), Development Expenditure (DE) stands at approximately RM 86.0 billion.

This RM 86.0 billion is deployed through two distinct channels:

  1. Direct State Allocations & Special Grants: Earmarked directly for specific state governments (e.g., Sabah's RM 6.9B + RM 600M MA63 grant).
  2. Centralized / Sectoral Ministry DE: Projects executed directly by federal ministries (Ministry of Works, Ministry of Rural & Regional Development, Ministry of Education, Defense, Health, etc.).

Combined Funding Comparison (Federal DE + Direct State Allocations)

By mapping both direct line items and ministry project spending back to their respective geographic regions, the total effective development expenditure breaks down as follows:

                          TOTAL FEDERAL DE ALLOCATION (~RM 86B)
                                           │
         ┌─────────────────────────────────┼─────────────────────────────────┐
         ▼                                 ▼                                 ▼
   SABAH REGION                   SARAWAK REGION                   PENINSULAR MALAYA
  ~RM 14.5 Billion                ~RM 12.5 Billion                 ~RM 59.0 Billion
 (Direct + Sectoral)             (Direct + Sectoral)              (Direct + Sectoral)

Detailed Regional Breakdown Table

Expenditure CategorySabahSarawakPeninsular Malaysia (Malaya)
Direct State Line-Item DERM 6.90 BRM 6.00 B~RM 20.00 B (across 11 states + FTs)
MA63 Special Grant (Art. 112D)RM 0.60 BRM 0.60 BN/A
Sectoral Ministry DE Spent in Region~RM 7.00 B (Pan Borneo, Southern Link Grid, SALAM Cable, Water Infra)~RM 5.90 B (SSLR Phase 1/2, Red Line Sibu, SALAM Cable)~RM 39.00 B (ECRL, MRT3, Federal Hospitals, Defense, Admin CAPEX)
Total Combined Federal DE~RM 14.50 Billion~RM 12.50 Billion~RM 59.00 Billion
Total Population (DOSM)3.76 Million2.50 Million27.80 Million
Malaysian Citizens Only2.72 Million2.40 Million25.00 Million

Per Capita Calculation

Using the per capita formula:

\text{Per Capita Allocation} = \frac{\text{Total Combined Federal DE (Direct + Sectoral)}}{\text{Population}}

1. Per Capita Basis (Total Population including Non-Citizens)

  • Sabah: \frac{\text{RM 14.50 Billion}}{\text{3.76 Million}} \approx \mathbf{RM\ 3,856\ / \text{person}}
  • Sarawak: \frac{\text{RM 12.50 Billion}}{\text{2.50 Million}} \approx \mathbf{RM\ 5,000\ / \text{person}}
  • Peninsular Malaysia: \frac{\text{RM 59.00 Billion}}{\text{27.80 Million}} \approx \mathbf{RM\ 2,122\ / \text{person}}

2. Per Capita Basis (Malaysian Citizens Only)

Because non-citizens make up ~27.7% of Sabah’s total population (~1.04 million individuals), calculating funding strictly per citizen changes the output:

  • Sabah: \frac{\text{RM 14.50 Billion}}{\text{2.72 Million}} \approx \mathbf{RM\ 5,330\ / \text{citizen}}
  • Sarawak: \frac{\text{RM 12.50 Billion}}{\text{2.40 Million}} \approx \mathbf{RM\ 5,208\ / \text{citizen}}
  • Peninsular Malaysia: \frac{\text{RM 59.00 Billion}}{\text{25.00 Million}} \approx \mathbf{RM\ 2,360\ / \text{citizen}}

Core Structural Insights

  1. The Combined Per Capita Premium: When combining direct state allocations and sectoral ministry project funding, Sabah receives roughly 1.8 times more federal DE per resident (and 2.2 times more per citizen) than Peninsular Malaysia on average.
  2. The Spatial Efficiency Ratio: The per-capita gap is intentional and stems from physical landmass and population density: \text{Population Density} = \begin{cases} \text{Peninsular Malaysia:} & \sim 210 \text{ people/km}^2 \\ \text{Sabah:} & \sim 51 \text{ people/km}^2 \end{cases} Laying a kilometer of water pipe or power line in Sabah serves far fewer people than the same distance laid along the Klang Valley or West Coast Peninsular corridor.
  3. Execution vs. Allocation Gap: While combined allocations place Sabah ahead on a per-capita basis, state economic reports and legal discussions frequently point out that actual project disbursement rates (spending on the ground) historically lag behind budget allocations due to tender bottlenecks, land acquisition delays, and administrative red tape.


Analyze the actual disbursement and execution rates of federal development expenditure in Sabah compared to what is allocated in annual national budgets.


A critical issue in Sabah's public finance is the gap between headline federal development allocations (announced annually in the national budget) and actual on-the-ground project disbursement.

While federal development expenditure (DE) allocated to Sabah reached record highs—rising from RM4.4 billion in 2022 to RM6.9 billion in Budget 2026—the execution rate varies significantly depending on whether projects are managed directly by Sabah State agencies or kept under Federal Ministry control.

Comparative Execution Performance

Execution ChannelTypical Annual Execution RatePerformance Profile
Federal Funds Managed Directly by Sabah State Agencies80% – 99.5%High Efficiency. The Sabah Ministry of Finance reported a 99.52% execution rate for federal allocations delegated to state agencies in 2025, placing Sabah as the 3rd best-performing state in Malaysia for state-managed federal funds.
Direct Federal Ministry-Executed Projects60% – 67%Systemic Lag. Historically, projects managed directly by federal ministries in Putrajaya average 60% to 67% utilization by Q4. Approximately 30% to 40% of allocated funds are routinely unspent, resulting in project rollovers or returned funds.

Primary Causes of Execution Lag in Direct Federal DE

1. Centralized Procurement and Putrajaya Approval Delays

Historically, project approvals, tender evaluations, and variation orders (VOs) required multi-tiered sign-offs from ministry headquarters in Putrajaya. This administrative structure created lead times of several months before contractors could draw down funds.

2. The Pre-Implementation "Bottleneck"

A significant portion of approved DE projects remain stuck in the pre-implementation phase. Out of over 1,180 projects approved for Sabah under the 5-year development plan, over 80% have been held in pre-implementation stages (feasibility studies, land acquisition, site surveys, and tender procurement), where financial disbursement is minimal compared to active physical construction.

3. Land Acquisition & Utility Relocation

Linear infrastructure projects—such as the Pan Borneo Highway Sabah (Phase 1A/1B), rural road connections, and high-voltage transmission lines—frequently face delays due to:

  • Lengthy negotiations regarding Native Customary Rights (NCR) land and land title acquisition.
  • Slow utility relocation (shifting existing water mains and electricity poles along expanding road alignments).

4. The Consolidated Fund Issue

Direct federal development allocations do not enter the Sabah State Consolidated Fund. Because the funds are retained and disbursed directly by federal ministry accounts in Putrajaya, local state agencies lack direct authority to reallocate underutilized funds toward faster-moving local projects within the same financial year.

Key Policy Interventions & MA63 Reforms

To resolve these execution bottlenecks, recent structural changes have been implemented under the Malaysia Agreement 1963 (MA63) framework:

1. Delegation of Technical Approval Authority (Up to RM50 Million) The Federal Government delegated full technical approval authority for development projects under RM50 million directly to Sabah’s Public Works Department (JKR Sabah) and Department of Irrigation and Drainage (JPS Sabah), bypassing Putrajaya approval queues.

2. Escalation of Special Grants The MA63 Special Grant under Article 112D was doubled to RM600 million, placing liquidity directly into state-administered channels for immediate local deployment.

3. Direct Project Delivery Committees Priority infrastructure—such as the RM1.67 billion Pan Borneo Sabah allocation, RM1.2 billion electricity grid support, and RM1 billion water infrastructure program—are increasingly being managed via joint federal-state technical committees to expedite tender awards and site handovers.


 The legal and political status of Sabah's 40% net revenue entitlement claim is defined by a landmark High Court ruling, subsequent appellate appeals, and ongoing negotiations regarding interim funding versus historical arrears.

1. Constitutional & Legal Framework

The 40% net revenue claim is rooted in the constitutional provisions negotiated under the Malaysia Agreement 1963 (MA63):

  • Article 112C & Tenth Schedule, Part IV, Section 2(1): Mandates a Special Grant to Sabah equivalent to 40% of the net revenue derived by the Federal Government from the state.
  • Article 112D: Mandates periodic 5-year joint reviews of this grant between the Federal Government and the Sabah State Government.
  • The "Lost Years" (1974–2021): Following the initial review in 1969, the Federal Government failed to conduct mandatory 5-year reviews for nearly 48 years. Instead, Sabah was paid a frozen, flat-rate annual grant of RM 26.7 million, disregarding the 40% formula.

2. The Landmark High Court Judgment (October 2025)

In a major legal precedent, the Kota Kinabalu High Court ruled in favor of the Sabah Law Society (SLS) in its judicial review action against the Federal Government (SLS v. Government of Malaysia & Anor):

  • Unconstitutional Omission: The High Court held that the failure to conduct reviews and calculate the 40% entitlement for the 48 "Lost Years" was unconstitutional, unlawful, and ultra vires Articles 112C and 112D.
  • Order of Mandamus: The court issued a mandatory order directing the Federal and Sabah State Governments to conduct an immediate constitutional review under Article 112D to determine and remit the 40% net revenue arrears for 1974–2021.
  • Strict Timelines: The High Court ordered negotiations to commence within 90 days and complete within 180 days (setting a deadline of April 15, 2026).

3. Current Appellate Status (2026)

Following the High Court's judgment, legal proceedings moved to the Court of Appeal:

  • Federal Attorney General's Appeal: The Federal Government filed an appeal challenging specific aspects of the High Court judgment—including the findings of breach/abuse of power and the imposition of court-mandated strict timelines.
  • Stay of Execution (April 2026): The Court of Appeal granted the Federal Government's application for a stay of execution on the High Court’s 180-day deadline, temporarily freezing the mandatory timeline pending the full hearing of the appeal.
  • Divergence Between Political Stance and Legal Filings:
    • Executive Position: The Prime Minister has repeatedly stated publicly that the Federal Government does not dispute the 40% entitlement principle and is committed to fulfilling MA63 obligations.
    • Legal Reality: The Federal AG's appeal and stay application mean that the exact computation method, liability for past arrears, and enforceability of strict judicial timelines remain actively contested in court.

4. Financial & Political Dynamics

                                SABAH 40% ENTITLEMENT PROFILE
┌──────────────────────────────────────┬──────────────────────────────────────┐
│        INTERIM SPECIAL GRANT         │        CONSTITUTIONAL 40% CLAIM       │
├──────────────────────────────────────┼──────────────────────────────────────┤
│ • Increased to RM 600 Million        │ • Estimated at Billions annually     │
│ • Paid "without prejudice"           │ • Includes historical arrears (48 yrs)│
│ • Governed by Article 112D           │ • Governed by Art 112C + 10th Sched  │
└──────────────────────────────────────┴──────────────────────────────────────┘
  1. Interim Funding vs. Constitutional Benchmark: Pending a final judicial resolution or bilateral settlement, the Federal Government increased the interim Special Grant to RM 600 million annually for Sabah. However, this is legally designated as an interim payment without prejudice to Sabah's constitutional claim under Article 112C.
  2. Sabah Political Landscape: The filing of the federal appeal and stay application generated significant public friction in Sabah. Regional political coalitions and civil society groups continue to press for a formal, binding settlement mechanism for the arrears rather than relying on ad-hoc interim grants.

Explain how 'net revenue' is legally defined and calculated under the Tenth Schedule of the Federal Constitution for Sabah's 40% claim.

Under Article 112C and Part IV, Section 2 of the Tenth Schedule of the Federal Constitution of Malaysia, Sabah’s 40% Special Grant is defined through a specific statutory formula.

1. The Core Constitutional Formula

Section 2(1) of Part IV states that the grant payable to Sabah in any financial year is:

\text{Special Grant} = 40\% \times \left( \text{Net Revenue}_{t} - \text{Net Revenue}_{1963} \right)

  • \text{Net Revenue}_{t}: The net federal revenue derived from Sabah in the current financial year t.
  • \text{Net Revenue}_{1963}: The baseline net federal revenue derived from Sabah in 1963 (calculated under the tax structures in place on Malaysia Day).

2. Statutory Definition of "Net Revenue"

Section 2(1)(b) of Part IV explicitly defines Net Revenue as:

"...the revenue which accrues to the Federation, less the amounts received by the State in respect of assignments of that revenue."

To calculate this value for any given year, two distinct variables must be calculated:

\text{Net Revenue}_{t} = \text{Gross Federal Revenue Derived from Sabah } (R_{\text{Fed}}) - \text{Revenue Assigned to the State } (R_{\text{Assigned}})

A. Gross Federal Revenue Derived from Sabah (R_{\text{Fed}})

This encompasses all revenue collected by, accruing to, or attributable to the Federal Government originating from the territory of Sabah. Under standard accounting and legal practice, this includes:

  • Direct Taxes: Personal Income Tax, Corporate Income Tax, Petroleum Income Tax (PITA), Real Property Gains Tax (RPGT), and Stamp Duties collected/derived from Sabah operations.
  • Indirect Taxes: Sales and Services Tax (SST), Customs Duties (Import/Export), Excise Duties, and windfall profit levies.
  • Non-Tax Revenue & Dividends: Federal share of petroleum royalties, regulatory fees, licenses, and federal statutory body or GLC dividends (such as PETRONAS dividends) directly attributable to resource extraction or economic activity in Sabah.

B. Permissible Deductions (R_{\text{Assigned}})

To prevent double counting, the formula deducts revenue that the Federal Government has already assigned directly to the State Consolidated Fund under Part V of the Tenth Schedule. These assignments include:

  • Import and export duties on petroleum products and timber/forest produce.
  • State sales taxes.
  • Port and harbour fees/dues (other than federal ports).
  • Other specific grants charged under Part V.

3. Key Legal & Accounting Controversies in Calculation

Because the Federal Constitution provides the legal principle rather than a step-by-step accounting manual, three primary legal debates surround how the calculation is operationalized:

1. "Derived From" vs. "Collected In"

  • The Federal Administrative View: Historically, federal reports primarily tracked taxes physically collected at tax offices located within Sabah.
  • The Constitutional/Legal View: Legal scholars and the Sabah Law Society emphasize the word "derived". Revenue derived from Sabah includes taxes paid at headquarters in Kuala Lumpur or Selangor by corporations whose revenue-generating assets, plantations, or oil wells physically operate in Sabah.

2. Petroleum Income & Offshore Territorial Limits

  • A major component of the calculation is Petroleum Income Tax (PITA) and PETRONAS dividends. A key legal dispute centers on whether revenue derived from offshore oil and gas fields within Sabah’s continental shelf and Exclusive Economic Zone (EEZ) constitutes revenue "derived from Sabah" under the 1963 baseline boundary definitions.

3. Revenue vs. Net Fiscal Position (The Expenditure Fallacy)

  • Politicians sometimes argue that federal operating expenses in Sabah (e.g., funding schools, police, healthcare, federal agency salaries) should be deducted from the revenue total.
  • Legal Position: From a strict statutory perspective, Section 2 of Part IV refers exclusively to Revenue, not net expenditure or fiscal deficit. Federal operating and development expenditures are separate constitutional duties governed under the Federal List, not deductible items under the Tenth Schedule calculation.


Wednesday, April 22, 2026

Pemberian Pulau Mangsee, Kagayan dan Penyu mungkin mengkhianati Hak Sabah

 https://en.wikipedia.org/wiki/History_of_Sabah#:~:text=The%20history%20of%20Sabah%20can,Crown%20Colony%20of%20North%20Borneo.


Berita ini tidak betul sebab pada 1932, masih Chartered Company, bukan British Colony. Lepas perang dunia 2, setahu aku, pulau pulau itu di beri sebagai hadiah kepada USA oleh UK setelah North Borneo menjadi koloni UK pada 1946. Tapi USA berikan kemerdekaan kepada Filipina pada tahun 1946. Pengambil alih kuasa USA untuk kawasan Sabah cuma di buat pada tahun 1947 secara resmi.


Ada pembohongan dan penipuan, sebab itu tidak konsisten.


Jadi bukan setakat administrasi atau pentadbiran sahaja sebelum 1946, tapi sa bahagian dari Sabah di bawah kawalan Chartered Company, yang memegang cagaran selama lamanya terhadap Sabah.


Jelas juga di 1930 USA and UK Convention:


https://elibrary.judiciary.gov.ph/thebookshelf/showdocs/35/13039#:~:text=WHEREAS%20a%20convention%20between%20the,Henry%20L.


ARTICLE III


All islands to the north and east of the said line and all islands and rocks traversed by the said line, should there be any such, shall belong to the Philippine Archipelago and all islands to the south and west of the said line shall belong to the State of North Borneo.


Perjanjian ini lah asas kawasan Filipina sebelum 1947.


Ertinya, UK mungkin melanggar perjanjian ini dan mengkhianati Sabah dengan memberi tanah Sabah kepada Filipina. Mau cari kuasa kerajaan Koloni dan perjanjian di antara Chartered Company dengan UK. 


Jelas juga dari Gemini. Jika perpindahan hak melibatkan penduduk, Parliament UK mesti meluluskan nya. Bukan sahaja di pulau pulau itu tapi keluarga mereka di tanah besar Sabah. Sabah boleh minta balik hak kepada pulau pulau tersebut.

The authority of a British colonial government to transfer territory or land to another sovereign power depends largely on the legal status of the colony and the specific period in history.

In British constitutional law, the transfer of territory is generally considered an exercise of the **Royal Prerogative**, but this power is not absolute and is often constrained by the role of the UK Parliament.

## 1. The Royal Prerogative vs. Parliament

Historically, the Crown had the power to cede territory under the Royal Prerogative (the executive power of the monarch). However, a significant legal shift occurred in the late 19th century.

 * **Pre-1890s:** It was widely believed the Crown could transfer land via treaty without Parliamentary consent.

 * **The Anglo-German Agreement (1890):** When the UK ceded **Heligoland** to Germany, the government of the day sought Parliamentary approval via an Act of Parliament. This set a lasting constitutional precedent: while the Crown negotiates the treaty, the actual transfer of British subjects' rights and the alteration of British territory usually requires **statutory authority**.

## 2. Settlement vs. Conquest/Cession

The type of colony dictated the level of local or parliamentary control:

 * **Settled Colonies:** In colonies where British settlers established themselves (like parts of Australia or North America), the settlers carried English law with them. The Crown’s power to change the law or transfer land without an Act of Parliament was more limited.

 * **Ceded or Conquered Colonies:** In territories acquired through war or treaty (like many parts of the Caribbean or Africa), the Crown initially held broader "plenary" powers to legislate via **Orders in Council**. In these cases, the colonial government (acting as the Crown’s representative) had more direct authority, but large-scale transfers to foreign powers still typically required London’s oversight.

## 3. The Role of Colonial Administrators

A colonial Governor or local administration rarely had the independent authority to transfer land to a *foreign* government on their own. Their powers were defined by **Letters Patent** and **Royal Instructions**.

 * **Internal Land Transfers:** Governors could grant or transfer land to individuals or corporations within the colony based on local land ordinances.

 * **External Transfers:** Any transfer of territory to another nation was a matter of foreign policy, which remained the exclusive domain of the Imperial Government in London.

## 4. Modern Statutory Requirements

For most of the 20th century, the decolonization process or the transfer of territory (such as the transfer of Hong Kong to China) was executed through specific Acts of Parliament (e.g., the **Hong Kong Act 1985**). This ensures that the executive cannot strip residents of their status or change the jurisdiction of the land without the oversight of the legislature.

### Summary Table: Authority Levels

| Action | Authority Required |

|---|---|

| **Granting land to a settler** | Local Governor (via Colonial Ordinances) |

| **Altering internal boundaries** | Order in Council (Executive) |

| **Ceding territory to a foreign power** | Treaty (Executive) + **Act of Parliament (Legislative)** |

> **Note:** While the Executive (the government) can sign a treaty to transfer land, that treaty cannot usually be enforced or finalized in a way that affects the rights of the inhabitants without Parliament passing a corresponding law.


Tuesday, February 24, 2026

Cara Malaya Mencuri Hak Reputasi Borneo

 Soalan kepada Gemini:

But with 90% cocoa being produced in borneo with Malaya only producing 10% in that Geographic identity, and given the wide difference in the land and weather of Borneo vs Malaya, is it fair that the low quality cocoa from Malays destroy the reputation of Borneo cocoa?


​Borneo’s volcanic soils (especially in areas like Tawau) and its distinct humidity levels create a flavor profile (often more fruity or floral) that is physically impossible to replicate in the soil of the Malay Peninsula. 


Satu cara lagi orang Malaya atau Malaysia mencuri hak Sabah dan Sarawak terang terangan dengan menggunakan reputasi Borneo untuk menjual Cocoa dari Malaya. Cocoa dari Malaya tidak boleh tandingi mutu cocoa dari Borneo terutama dari Sabah iaitu Tawau. Sebab itu orang Malaya mengguna branding Malaysia Cocoa untuk menipu pelanggan. Jadi jangan beli cocoa yang di label Malaysia Cocoa. Ini di panggil consumer deception tapi di benarkan oleh undang undang. 


​In international trade, if "Malayan" cocoa is sold as "Borneo" cocoa, it is considered Consumer Deception. However, if both are sold as "Malaysian," it is legally "accurate" but commercially "unfair" to the Borneo farmers who do the heavy lifting.


Mutu cocoa dari Sabah jauh lebih baik dari yang dari Malaya. Cocoa dari Sabah selalunya ada lebih rasa buahan dan bunga bungaan. 


https://g.co/gemini/share/9cfbeefb7e3f

Why Malaya keeps on wanting to negotiate MA63 for eternity?

Makes sense. My main concern is the theft of more than 1 trillion RM based on current value, based on constitution. The MA63 has more conditions such as 100% Borneonisation of all civil service which has monetary and other  losses to Sabah as well. Imagine the salaries that Sabahan loses to Mslayans working in Sabah. In fact together with this clause, the 40% special grant should exclude salaries to Malaysn people because those money cannot be treated as Sabahan money.


 Since 1963, Sabah has never truly recovered its autonomy because the system that was supposed to protect it under the Malaysia Agreement 1963 was dismantled — quietly, legally, and deliberately — by federal centralisation after 1963.


Malaysia knows this.


That is why Sabah today does not ask for administrative reform.

Sabah demands sovereignty.


Why Malaysia still negotiates even if MA63 is void


If MA63 is void ab initio, Malaysia never acquired lawful sovereignty over Sabah under international law.


Yet Malaysia still negotiates — because refusal would legally amount to:


• Illegal occupation

• A continuing breach of international law

• Exposure to sanctions, diplomatic isolation, and international litigation


This is not theoretical.

It has happened before.


It is exactly what occurred when Indonesia was compelled to negotiate over East Timor,

and when South Africa was forced to relinquish Namibia.


In both cases, the occupying power exercised “constitutional control” — yet the international community ruled that control illegal and demanded negotiations for decolonisation.


The legal truth


Malaysia’s continued presence in Sabah rests on MA63.

If MA63 collapses in law, so does Malaysia’s title.


That is why Malaysia negotiates.


Not out of goodwill —

but because international law leaves it no choice.


Sabah is not a state begging for autonomy.

Sabah is a people reclaiming sovereignty.


https://www.facebook.com/share/17JDHwc11N/


Tuesday, December 23, 2025

How Voting Power of Sabah Robbed by Malaya

 1963-1964: voter's/MP

Trengganu 25,000

Sabah 9375

Selangor 32,000


2025

Trengganu 115,000

Sabah 68,000

Selangor 168,000


Period State Total Parliamentary Seats Total Registered Voters Avg. Voters Per Seat

1963/64 Selangor 14 ~450,000 ~32,000

  Sabah 16 ~150,000* ~9,375

Present (2024) Selangor 22 ~3,700,000 ~168,000

  Sabah 25


Voting power of Sabah Vs Selangor reduced from 3.4 to 2.5.


​2. The "Weight" of a Vote

​The "value" of a vote is often measured by how many voters it takes to elect one Member of Parliament (MP).

​1963: A voter in Sabah had roughly 3.4 times the "voting power" of a voter in Selangor. This was a deliberate constitutional design to protect the interests of the less populous Borneo states.

​Present: Today, a voter in Sabah has roughly 2.5 times the voting power of a voter in Selangor.


Dari Gemini:

Number of parliamentary seats per voter in Trengganu Vs Sabah in 1963 Vs the .present


​Note on 1963 Data: In 1963, Sabah's first representatives were indirectly elected by the State Legislative Assembly rather than through a direct popular vote. The first direct parliamentary elections for Sabah occurred in 1969/1970. The 1964 data for Terengganu is used as it was the first general election after the formation of Malaysia.

​Key Historical & Modern Differences

​1. The "Borneo Weightage" (1963)

​When Malaysia was formed, Sabah (16 seats) and Sarawak (24 seats) were given a high seat-to-voter ratio. This was a constitutional safeguard to prevent the Peninsular states from having a "two-thirds majority" that could unilaterally amend the Constitution. At the time, a voter in Sabah had nearly 3 times the representative power of a voter in Terengganu.  

​2. The Impact of "Undi18" and Automatic Registration

​The jump in voter numbers in the "Present" column is largely due to the 2021 implementation of Undi18 (lowering the voting age) and Automatic Voter Registration (AVR).

​Terengganu: Now has a very high concentration of voters per seat (115,000+), meaning its seats are among the most "heavily loaded" in the country.

​Sabah: While its voter base has exploded, its 25 seats still result in a much lower average (67,000) compared to Terengganu. This is partly due to its vast geography and the continued application of "rural weightage."

​3. Constituency Maldistribution

​The present-day figures highlight a common critique of the Malaysian electoral system: malapportionment.

​In Terengganu, seats like Kemaman have over 139,000 voters.

​In Sabah, while some seats are large, others like Igan (in neighboring Sarawak, but following a similar Borneo trend) or smaller Sabah rural seats have significantly fewer voters, maintaining the "Borneo advantage" originally intended in the 1963 Malaysia Agreement (MA63).

​Would you like me to look up the specific voter counts for the largest and smallest individual seats within Terengganu and Sabah to see the internal disparity?


Introduction

This blogspot is filled with Adsense links. These google advertising links can be useful but their uses are strictly governed. I earn cash if any of you click these links but if I or my close acquaintances click them, google is very harsh in permanently banning me. Please do not click these adverts unnecessarily.

Learn how to earn money by clicking the button below: